In the spring of 2025, a logistics manager at a Vietnamese electronics manufacturer received a phone call that would reshape her factory’s capacity planning for the next two years. A US importer she had never dealt with before wanted to relocate its entire sourcing programme — 40,000 units a month of consumer electronics — from an existing Chinese supplier to her facility in Binh Duong. The reason was simple: tariffs. Her Chinese counterpart’s goods had just become 145% more expensive at the US border. Her factory, producing equivalent products with many of the same components from the same upstream Chinese suppliers, faced a 46% tariff instead.
The phone call lasted 45 minutes. The contract was signed within a week.
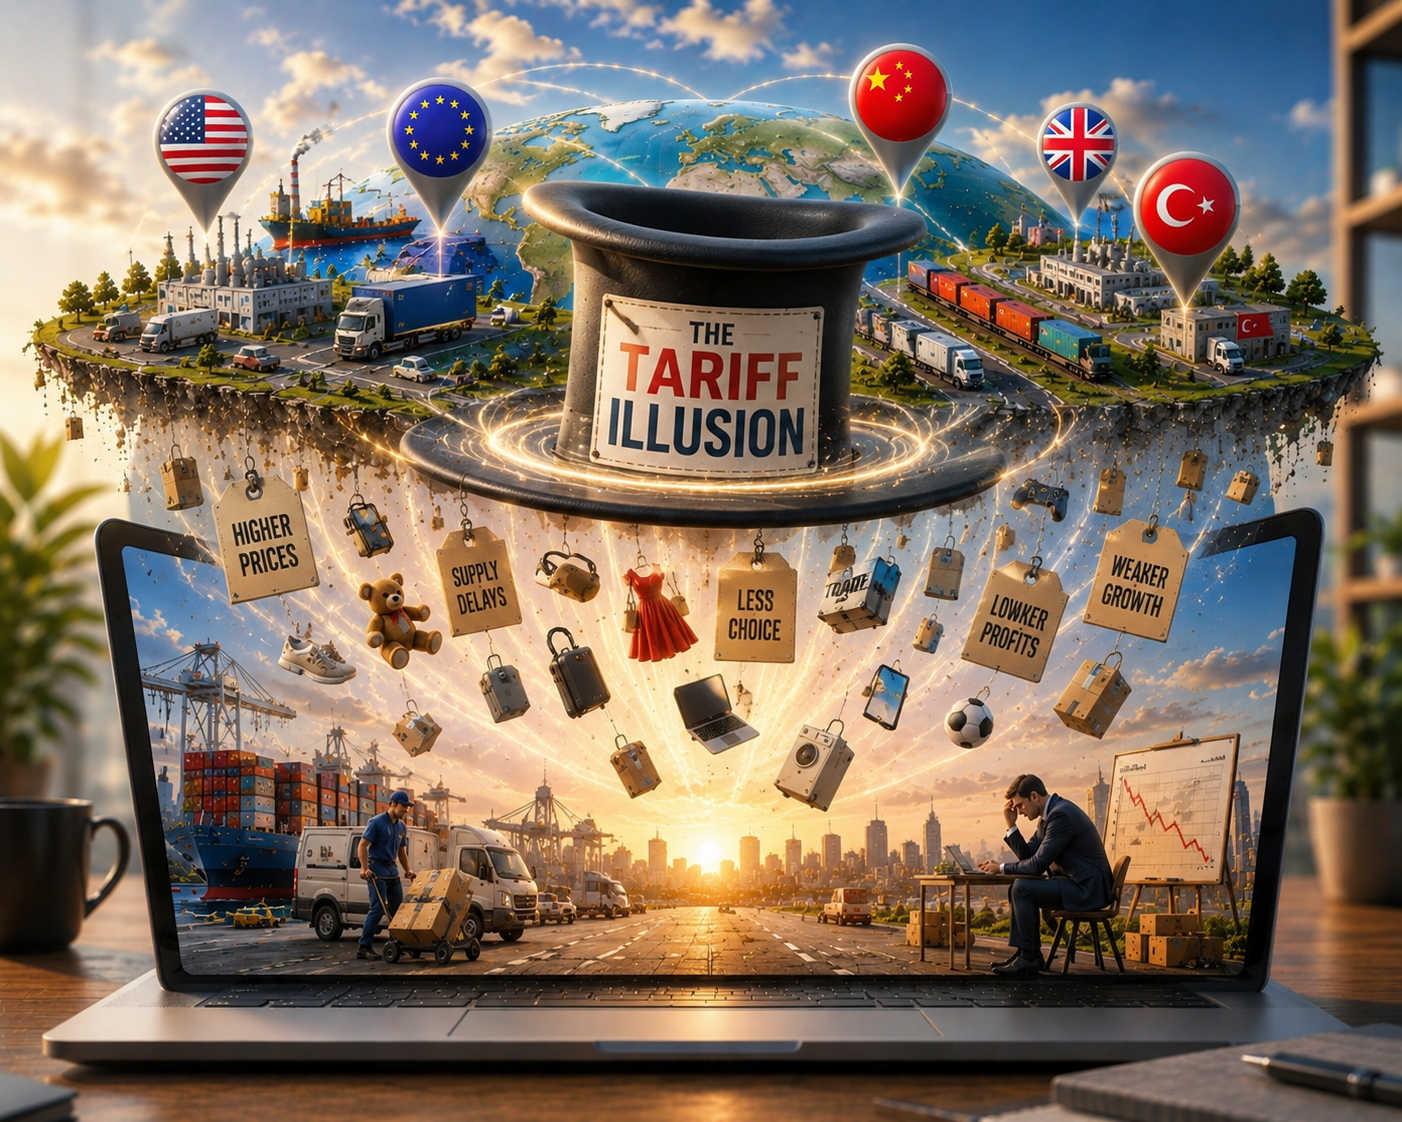
That is the tariff illusion. Not that tariffs do nothing — they do a great deal. But what they do is not what their architects say they will do. They do not bring manufacturing home. They do not restore trade balances. They do not decouple supply chains. They redirect them.
The Promise and the Reality
Every significant tariff regime of the past decade has been sold on the same narrative: by making foreign goods more expensive, domestic industry will be protected, jobs will return, and the trade deficit will narrow. It is an intuitively appealing argument. It is also, as a matter of observed commercial behaviour, largely wrong.
In 2018, when the first tranche of US tariffs on Chinese goods was introduced, China accounted for 21.6% of total US goods imports, with a nominal value of $505 billion. By 2024, China’s share had fallen to 13.4%. Yet China’s actual import value in 2024 was $439 billion: a $66 billion decline over six years, while total US imports grew from approximately $2.5 trillion to over $3.3 trillion.
What the Data Says
The geography of that redirection is now visible in six years of trade statistics. The story is not one of reduced trade. It is a story of trade growing by nearly a third while its origin shifted. Mexico overtook China as the United States’ largest trading partner in 2023. Vietnam’s trajectory is more dramatic still: US imports from Vietnam have grown by nearly 400% since 2018, reaching $193.8 billion in 2025 as importers front-loaded inventory ahead of tariff escalations.
Source: US Census Bureau; Federal Reserve Bank of New York
| Origin | 2018 (USD bn) | 2024 (USD bn) | Change |
|---|---|---|---|
| China | $505bn | $439bn | −13% |
| Vietnam | $49bn | $136bn | +178% |
| Mexico | $347bn | $506bn | +46% |
| India | $54bn | $87bn | +61% |
| Total US Imports | ~$2,500bn | ~$3,300bn | +32% |
Source: US Census Bureau
The Federal Reserve Bank of New York identified a $158 billion import gap between what the US reports buying from China and what China reports selling. The goods did not disappear. They rerouted. A material proportion now classified as Vietnamese or Malaysian in origin carries Chinese components, Chinese capital and Chinese production management behind it. The tariff shifted the paperwork. It did not necessarily shift the supply chain.
Source: US Census Bureau
The Geography of Redirection
Vietnam: The Factory That Absorbed the Shock
Vietnam was already a growing manufacturing hub before the 2018 tariffs. The tariffs did not create the corridor; they turbocharged it. By 2024, Vietnam had received cumulative FDI of more than $480 billion, with China among the largest annual investors in recent periods. Vietnam captured 85% of Chinese consumer-electronics greenfield investment across ASEAN between 2018 and 2024.
For Western importers, moving supply from Shenzhen to Binh Duong does not necessarily reduce Chinese commercial exposure. It may reduce tariff exposure. Buyers who did not interrogate ownership, component sourcing and management found that their supply chain was structurally similar to before — with a different flag at the factory gate and another logistics cost.
That distinction matters. A change in the declared origin of a finished good can reduce border exposure while leaving the underlying component dependency, capital ownership and production-management model intact. The supply chain may be more diversified geographically without being less exposed commercially.
Mexico: The Nearshore Play
Mexico’s story is different and more instructive about genuine trade redirection. Its manufacturing growth is not primarily a Chinese relocation story. It is a nearshoring story: US and European companies moved production closer to their end market. Automotive, electronics, medical devices and aerospace have all seen investment, while USMCA provides a rules-of-origin framework that requires real domestic content rather than merely final assembly.
Turkey: The Corridor That Positions Itself
Turkey sits within the EU customs union while maintaining its own bilateral trade relationships. It has a manufacturing base supplying European retailers across home goods, electronics, automotive components and consumer categories. Its outbound cross-border trade is growing at 31% annually, the fastest in EMEA.
For UK businesses, the specific opportunity is a sourcing corridor that benefits from the same CBT architecture that makes China-Europe trade work — bonded logistics, duty deferral and platform relationships — but at shorter distance, with a more familiar cultural framework and a post-Brexit bilateral relationship that is still being written.
Goods from China and Central Asia can enter Turkey, undergo legitimate value-adding processing and reach EU or UK markets under Turkish rules of origin. In textiles, ceramics and consumer goods, that can represent genuine manufacturing rather than the tariff-washing caricature. The commercial task is to distinguish the two.
India: The Long Game
India’s trajectory is slower-moving but potentially decisive over a ten-year horizon. US imports from India grew from $54 billion in 2018 to $87 billion in 2024, reaching $103.8 billion in 2025. Electronics, engineering goods and generic pharmaceuticals lead the expansion. For European buyers, India is not only tomorrow’s opportunity; it is the next tier of today’s redirection story.
The Laundering Problem
The darker edge of redirection is no longer theoretical. The Coalition for a Prosperous America’s China Transshipment Monitor 2026 estimates $75 billion in diverted Chinese trade routed through 17 third countries and $70 billion in lost US tariff revenue. The effective collection rate on Chinese goods is materially below the statutory rate once rerouting is accounted for.
For UK and European operators, this means rules-of-origin scrutiny is intensifying. EU customs reform, US Customs and Border Protection audits and the UK’s post-Brexit customs architecture are moving in the same direction: greater transparency over the beneficial origin of goods, not merely a declared country label.
E-Cargo Logistics operates in precisely this space: specialist cross-border freight and customs documentation across multi-country supply chains. Its category is a market signal. Compliant trade infrastructure is increasingly being priced as a premium, not an administrative cost.
DHL’s China Plus X framework makes the same strategic point at scale: multi-shoring is not about abandoning China, but about ensuring that no single country of origin is a point of failure. Its Trade Atlas 2025 confirms that global trade is continuing to grow despite the policy shocks, with risk concentrated in a small number of corridors.
What I Saw From the Inside
When the first tranche of US tariffs on Chinese goods was announced in 2018, I was still close to the Alibaba ecosystem. Over the following 18 months, major Chinese cross-border sellers began reconfiguring their entity architecture, inventory routing and platform relationships. They did not move factories overnight. They restructured the commercial architecture around the factories.
The lesson is the asymmetry between the speed at which Chinese operators can respond to regulatory change and the speed at which Western buyers and regulators can understand that response. It reflects commercial culture, organisational agility and accumulated experience of exporting at scale.
Arthur Chang, who built eBeauty and UCO Cosmetics into significant cross-border businesses from a Chinese base, navigated that period with the operational rigour most Western commentary missed. John Lin, as eBay’s CEO for Greater China, saw the same adaptation across thousands of Chinese sellers: fulfilment moved, registration moved and inventory routing changed. The goods did not meaningfully change.
Capital Follows Trade
Trade redirection does not travel alone. Capital follows it. Chinese investment is mapping the new corridors: Vietnamese industrial infrastructure, Mexican assembly capability, Turkish logistics and CBT platform capacity, and the freight and warehousing networks linking those hubs to Western markets.
David Wei, whose commercial career spans Alibaba, JD.com and private equity, has been a consistent voice on this structural shift. Capital does not wait for trade policy to settle; it maps the emerging routes and positions ahead of the volume.
DP World’s Jebel Ali Free Zone recorded $190 billion in annual trade, up 15% year on year. It illustrates why trusted, compliant, strategically governed free zones become more valuable as the trade architecture fragments. James Dong’s international Alibaba network — AliExpress, Lazada and Trendyol — spans precisely the corridors through which redirected trade is now moving.
The Platform Wildcard
TikTok Shop has created a direct-to-consumer channel connecting manufacturers and sellers to Western consumers in ways that partly bypass traditional retail infrastructure. Its global GMV grew from $1 billion in 2021 to $33.2 billion in 2024, with 2025 projections of $66.2 billion.
At the same moment, the EU has begun to dismantle the de minimis framework that allowed 4.6 billion parcels — 91% from China — to enter the EU duty-free in 2024. The €150 threshold was abolished on 1 July 2026, with a transitional €3 flat duty planned from November 2026 and a full tariff regime expected by mid-2028. The economics of the direct-from-factory model are changing fundamentally.
For European brands, the implication is both competitive threat and channel opportunity. TikTok Shop rewards content velocity and product demonstrability rather than inherited brand scale. European SMEs with strong products and limited paid-media budgets can find discovery there in ways that were less available on Amazon or Google. The same platform is forcing incumbents such as Mars to integrate platform sales, consumer behaviour and supply-chain visibility across a rapidly changing omnichannel landscape.
The Opportunity Hiding in Plain Sight
The tariff did not reduce trade. It redistributed it. Total volumes grew. Origin and routing changed. Compliance became more complex. The speed of the shift — measured in months, not years — has outpaced the frameworks most Western businesses use to assess supply-chain risk.
The new corridors are not yet crowded. Vietnam is known to large buyers, but SME infrastructure remains immature. India is earlier. And the Turkey-UK bilateral relationship remains less developed than Turkey-EU trade despite clear commercial logic. Businesses building direct relationships, compliant CBT logistics and platform presence in these corridors in 2026 are creating route knowledge that will be much harder to replicate in three years.
The Opportunity — One Clear Takeaway
If you are a UK or European business that sources goods, sells into new markets or competes with operators who do, this redirection is not merely a threat to manage. It is a structural advantage to claim. The trade is moving. The infrastructure is following. The question is whether your business is positioned on the right side of the redirection.
I have spent 25 years watching trade flows adapt to political intervention — at Alibaba, eBay, SGS and in my own practice across Turkey, China and Europe. The policy creates the friction. The trade finds the path. The advantage goes to the operator who maps that path first.
Next: Chapter 3 — Cross-Border Trade. Why CBT is structurally less exposed to tariff pressure than traditional trade, and what that means for businesses building position now.
Back to All Chapters →Data Sources
- US Census Bureau — Trade in Goods Statistics by Country, 2018–2025
- Federal Reserve Bank of New York — U.S. Imports from China Have Fallen by Less Than U.S. Data Indicate, February 2025
- Dallas Federal Reserve — Mexico seeks to solidify rank as top U.S. trade partner, 2023
- Coalition for a Prosperous America — China Transshipment Monitor 2026
- Oxford Economics — The Economic Impact of TikTok Shop in Germany in 2025
- DP World — JAFZA Turns 40 with Record $190bn in Trade, May 2025
- DHL — Trade Atlas 2025
- EU Commission / European Council — de minimis reform, effective July 2026
- Indian Ministry of Commerce — India export statistics Q4 2025